Resources
Suggestions for Obtaining Data
Annual average of Temperature, Relative Humidity (RH), and Rain (Precipitation)
- Contact the local weather station
- The USA's National Oceanic and Atmospheric Administration (NOAA) website containing Comparitive Climatic Data Charts and Data Mapping Tool. Of particular interest are the following resources:
-
- NOAA Normal Precipitation, Inches report and the total annual average value.
- NOAA Normal Daily Mean Temperature, °F report and the total annual average vale.
- NOAA Average Relative Humidity: Morning (M), Afternoon (A) report. It is possible to use an average of the morning and afternoon annual average value.
- For Canadian cities, climatic data is published by the Government of Canada - Canadian Climate Normals and Average Values from 1981-2010 by city, province, territory or proximity to a known location. No additional data has been published since 2010.
Sulfur Dioxide (SO2) Deposition
-
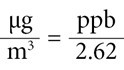
Annual data obtained in parts per billion (ppb) can be converted using the below formula:
- For the US, general trends for SO2 concentrations in parts per billion are provided by the region from the US Environmental Protection Agency (EPA) for general regions. EPA also provides a map representation of the data sorted by year.
- The Canadian government collects average annual SO2 values in parts per billion for general regions. See published table " Number of stations selected for the national and regional air quality indicators". The most recent data is from 2016. Average sulfur dioxide data for each collection site is also available in interactive map form (Air Quality - Average Sulfur Dioxide).
Air Salinity
- For rural areas without the pollution from traffic or industrial settlements a value less than 5 mg/m2/day can be used for the Cl concentration.
- In urban and industrial locations, contact the municipality or state federal environmental federal agencies. Cl content in the air is not always monitored.
Sample Environments
| City | Country | Type | Rain | Salinity (Chlorides) | Sulfur Dioxide | RH | Temp. | Length of Testing | Actual Rate | Predicted Rate |
|---|---|---|---|---|---|---|---|---|---|---|
| mm/y | mg/m2*day | mg/m2*day | % | °C | years | μm/year | μm/year | |||
| Stockholm | Sweden | Urban | 540 | <5 | 8 | 72 | 8 | 2 | 1.0 | 1.0 |
| Rio de Janeiro | Brazil | Marine | 1250 | 15 | 40 | 80 | 22 | 1 | 1.5 | 1.8 |
| Bethlehem | USA | Industrial | 940 | 3 | 25 | 68 | 11 | 2 | 1.3 | 1.2 |
| Madrid | Spain | Industrial | 430 | <5 | 37 | 63 | 14 | 2 | 0.7 | 0.9 |
| Hanoi | Vietnam | Urban | 1850 | 1 | 3 | 83 | 24 | 2 | 1.1 | 1.0 |
| Ryda | Sweden | Rural | 553 | 1 | 5 | 82 | 5 | 2 | 0.8 | 1.0 |
| Phoenix | USA | Rural | 207 | 2 | 3 | 37 | 22 | 2 | 0.3 | 0.4 |
| Washinton, DC | USA | Urban | 998 | 3 | 90 | 62 | 14 | 1 | 1.8 | 3.0 |
| Kure Beach | USA | Marine | 1100 | 91 | 1 | 77 | 18 | 1 | 2.0 | 2.0 |
The data shown in the above table were taken from the published literature as examples to illustrate the possible values for the environmental parameters and corrosion rate. The corrosion rates listed are the results of the environmental conditions specific to the location where the exposure was made. Each value may or may not represent the typical corrosion rate of a city where the corrosion rate may be different for different locations. The values are also specific to the year when the exposure tests were carried out since the environmental condition can vary from one year to another for the same location.